Background: Nova Scotia L&F Minister Rankin acknowledges the “Polygon Problem” in constructive “meeting” on Social Media 16Jan 2019
Post on NSFN Jan 18, 2019
One limitation I see to the DNR/L&F Old Forest Policy/Old Forest Scoring (which I will refer to as the “OFP Protocol”) is the “Polygon Problem”. To qualify as Old Growth under the OFP Protocol criteria*, a whole forest polygon must meet the criteria based on 3 randomly sampled sites within the polygon (re: “Selections must be large enough to be identified as a stand in the GIS”).
* “Old Growth: A forest stand where 30% or more of the basal area is in trees 125 years or older, at least half of the basal area is composed of climax species, and total crown closure is a
minimum of 30%.”
This is problematical for at least two reasons:
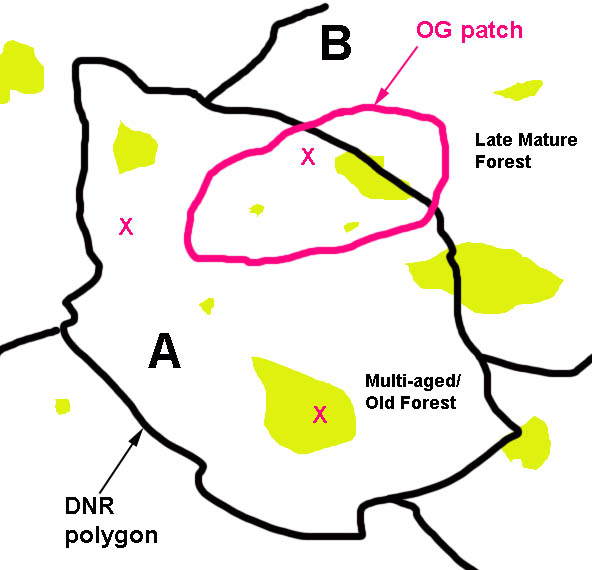
Hypothetical patch of Old Growth in relation to hypothetical DNR polygons. Yellow patches are forest in earlier successional stages following gap disturbances. X’s are randomly chosen sampling points
(i) Old Growth forests have gaps where trees have blown down, and a new succession begun. That’s a normal process in multi-aged old growth forests. So if even just one of the three samples in a legitimately Old Growth Forest polygon happened to hit a gap, in many cases that would be enough to skew the stats under the DNR scheme sufficiently that it would not qualify as Old Growth.
(ii) Sampling based on DNR’s polygons means that patches of Old Growth significantly smaller in area than than one whole polygon are not likely to be “caught”. That is a deliberate, not inadvertent aspect of the OFP Protocol.
Much or most of the remaining Old Growth in Nova Scotia that has not been formally identified exists in patches smaller than whole polygons, and some may run though more than one polygon, making them effectively smaller from a sampling perspective.
Yet these smaller-than-forest-polygon patches of Old Growth are still important, if for no other reason, as “nuclei” of Old Growth in regenerating forest around them; they conserve for example microbial species peculiar to Old Growth, thereby allowing faster development of that microflora in the regenerating forest.
I became familiar with these sorts of limitations to the OFP Protocol in the course of conducting natural history oriented surveys of forests in the area of Sandy Lake, Bedford, NS in 2017 as a volunteer for the Sandy Lake Conservation Association.
On my first field day, on June 15, 2017, I was introduced by a local resident to a spectacular Old Growth hemlock stand on “The Peninsula” that sticks out into Sandy Lake. A professional forester who works for NS Power and whose family has resided in that area for generations got DNR to evaluate it using the Old Forest Scoresheet in October of 2014. It came in with flying colours – over 200 years old, and it neatly filled a whole polygon:
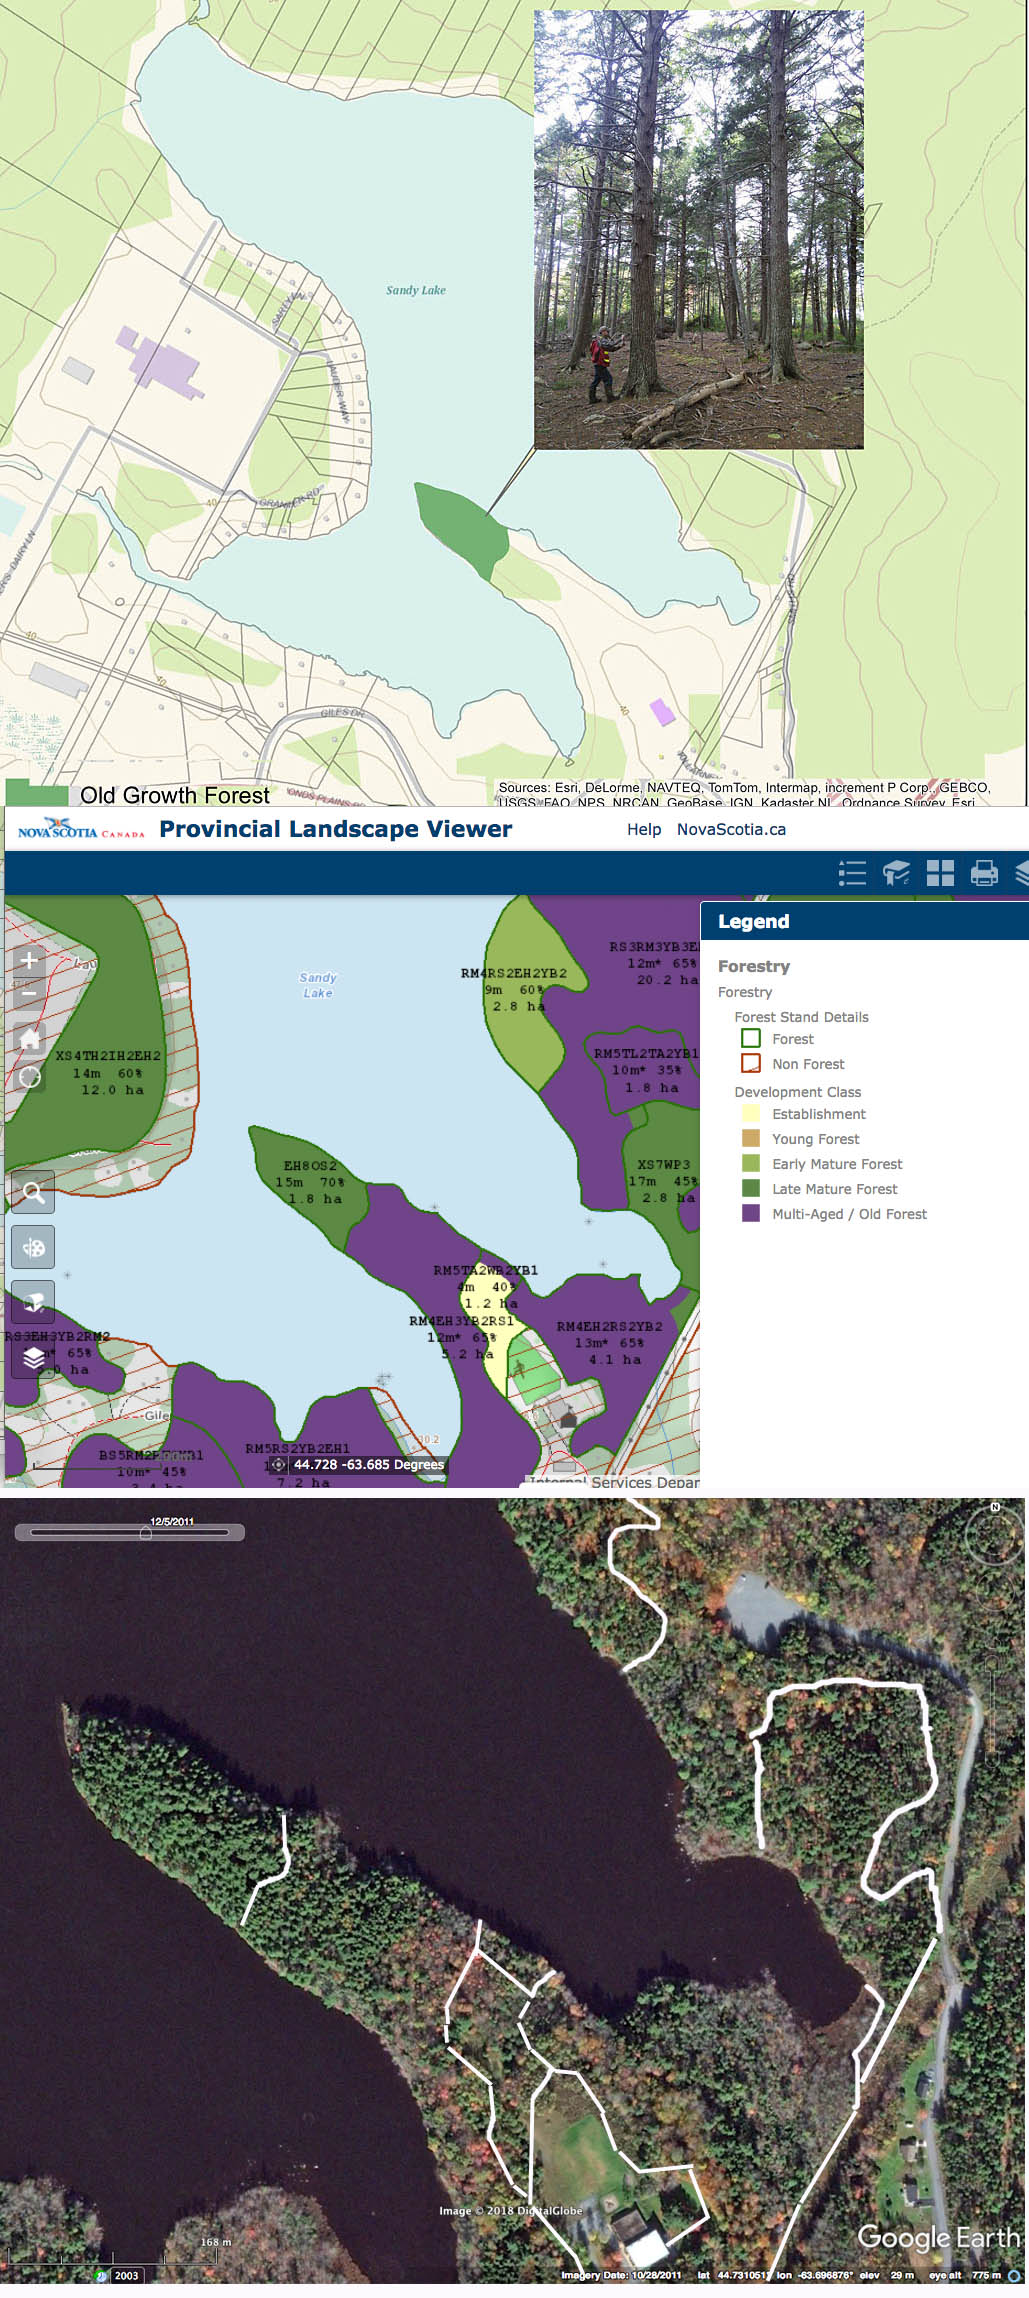
Old Growth stand on The Peninsula
Top: Map prepared by Ed Glover showing the stand on The Peninsula that was assessed using the Old Forest Scoresheet
Middle: Development Class and Forest Stand Details in the Provincial Landscape Viewer
Bottom: Google Earth image, stand boundaries in white.
The Peninsula lands are owned by the Sandy Lake Academy.
There was talk that a clearcut on the west side of the lake in 2013 had removed “old growth” but there wasn’t much documentation. An investigation of the clearcut area revealed stumps more than 100 years old, and some patches of large trees in some of the riparian areas that had not been cut.
Not much was known about possible Old Growth in the extensive forests that occur in broad sweeps from Hammonds Plains Road through to the Sackville River. There had been a lot of forestry in the area in the past but most of it did not involve clearcutting and there has not much within the last 30-50 years. I hiked various routes (some marked out, some not) through the area noting all trees along my routes 16″ (41 cm) dbh (diameter at beast height) and larger. Over much of the area, the largest trees are ~10-12″ (25-30 cm) dbh. However, I found patches of larger trees with some well above 2 ft (61 cm) dbh, and observed other features, such as pit and mound topography, old snags and coarse wood debris that were suggestive of Old Growth. I selected 3 patches as representative of 3 forest stand types.
I asked Colin Gray, Coordinator of MTRI’s Old Forest Project, to help me with assessing the 3 patches (not whole DNR polygons) I had mapped out as potential Old Growth stands using the OFP Protocol. However Colin had to sample on the basis of DNR identified polygons that enclosed or partially enclosed “My Polygons”.
My Polygon for Stand 1 fairly fit the DNR polygon fairly closely:
STAND 1
Top: Google Earth Image/Stand Details Layer in PLV. The red envelop is “My Polygon” (o.46 ha), selected to include an area of large trees. View Big Trees for info about the “bubbles”.
Bottom: Development Class and Forest Stand Details in the Provincial Landscape Viewer
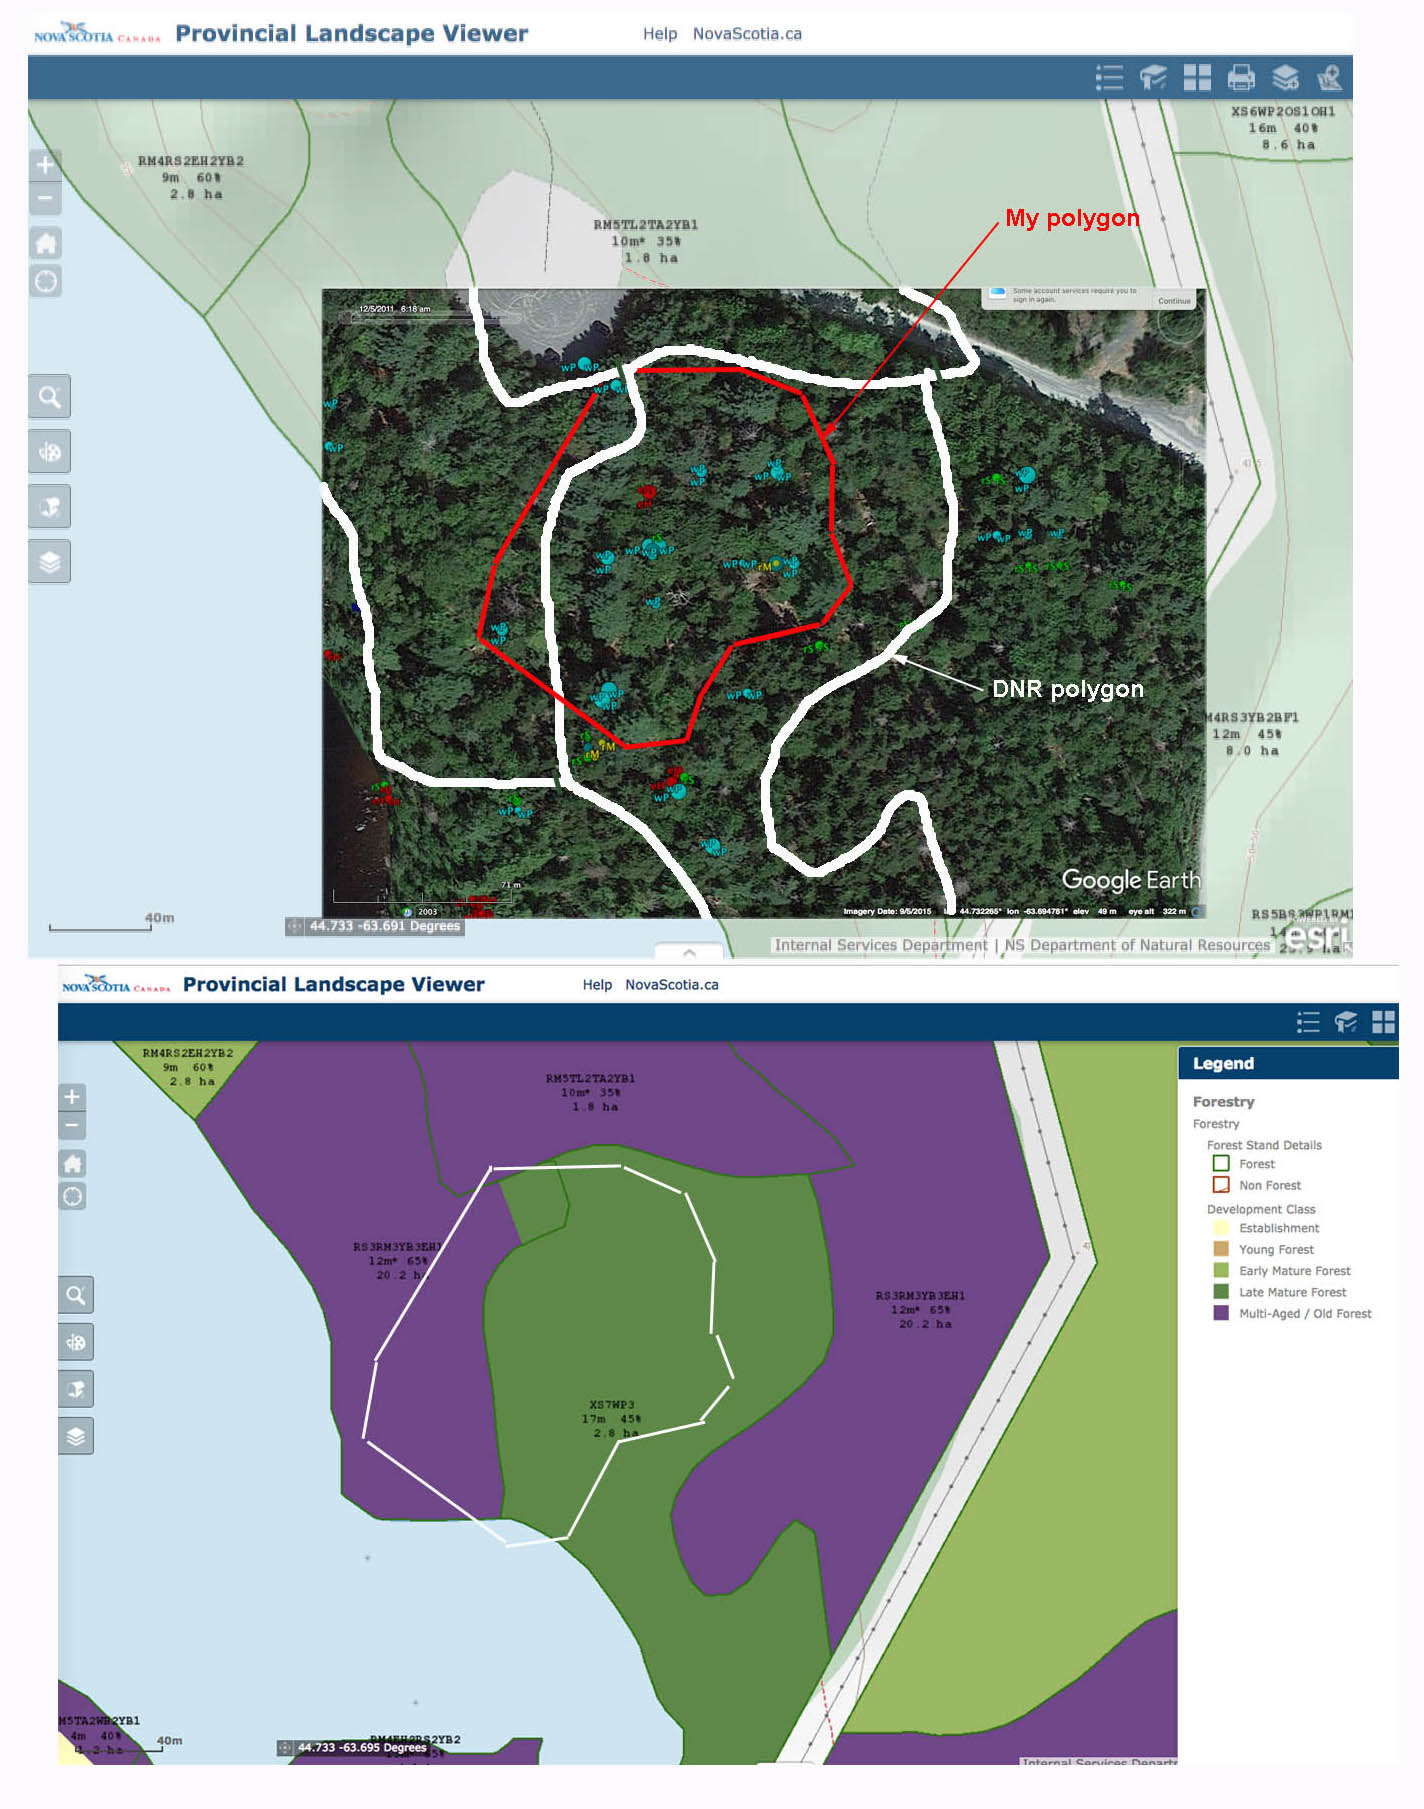
My Polygons for Stands 2 and 3 did not coincide well with DNR polygons:
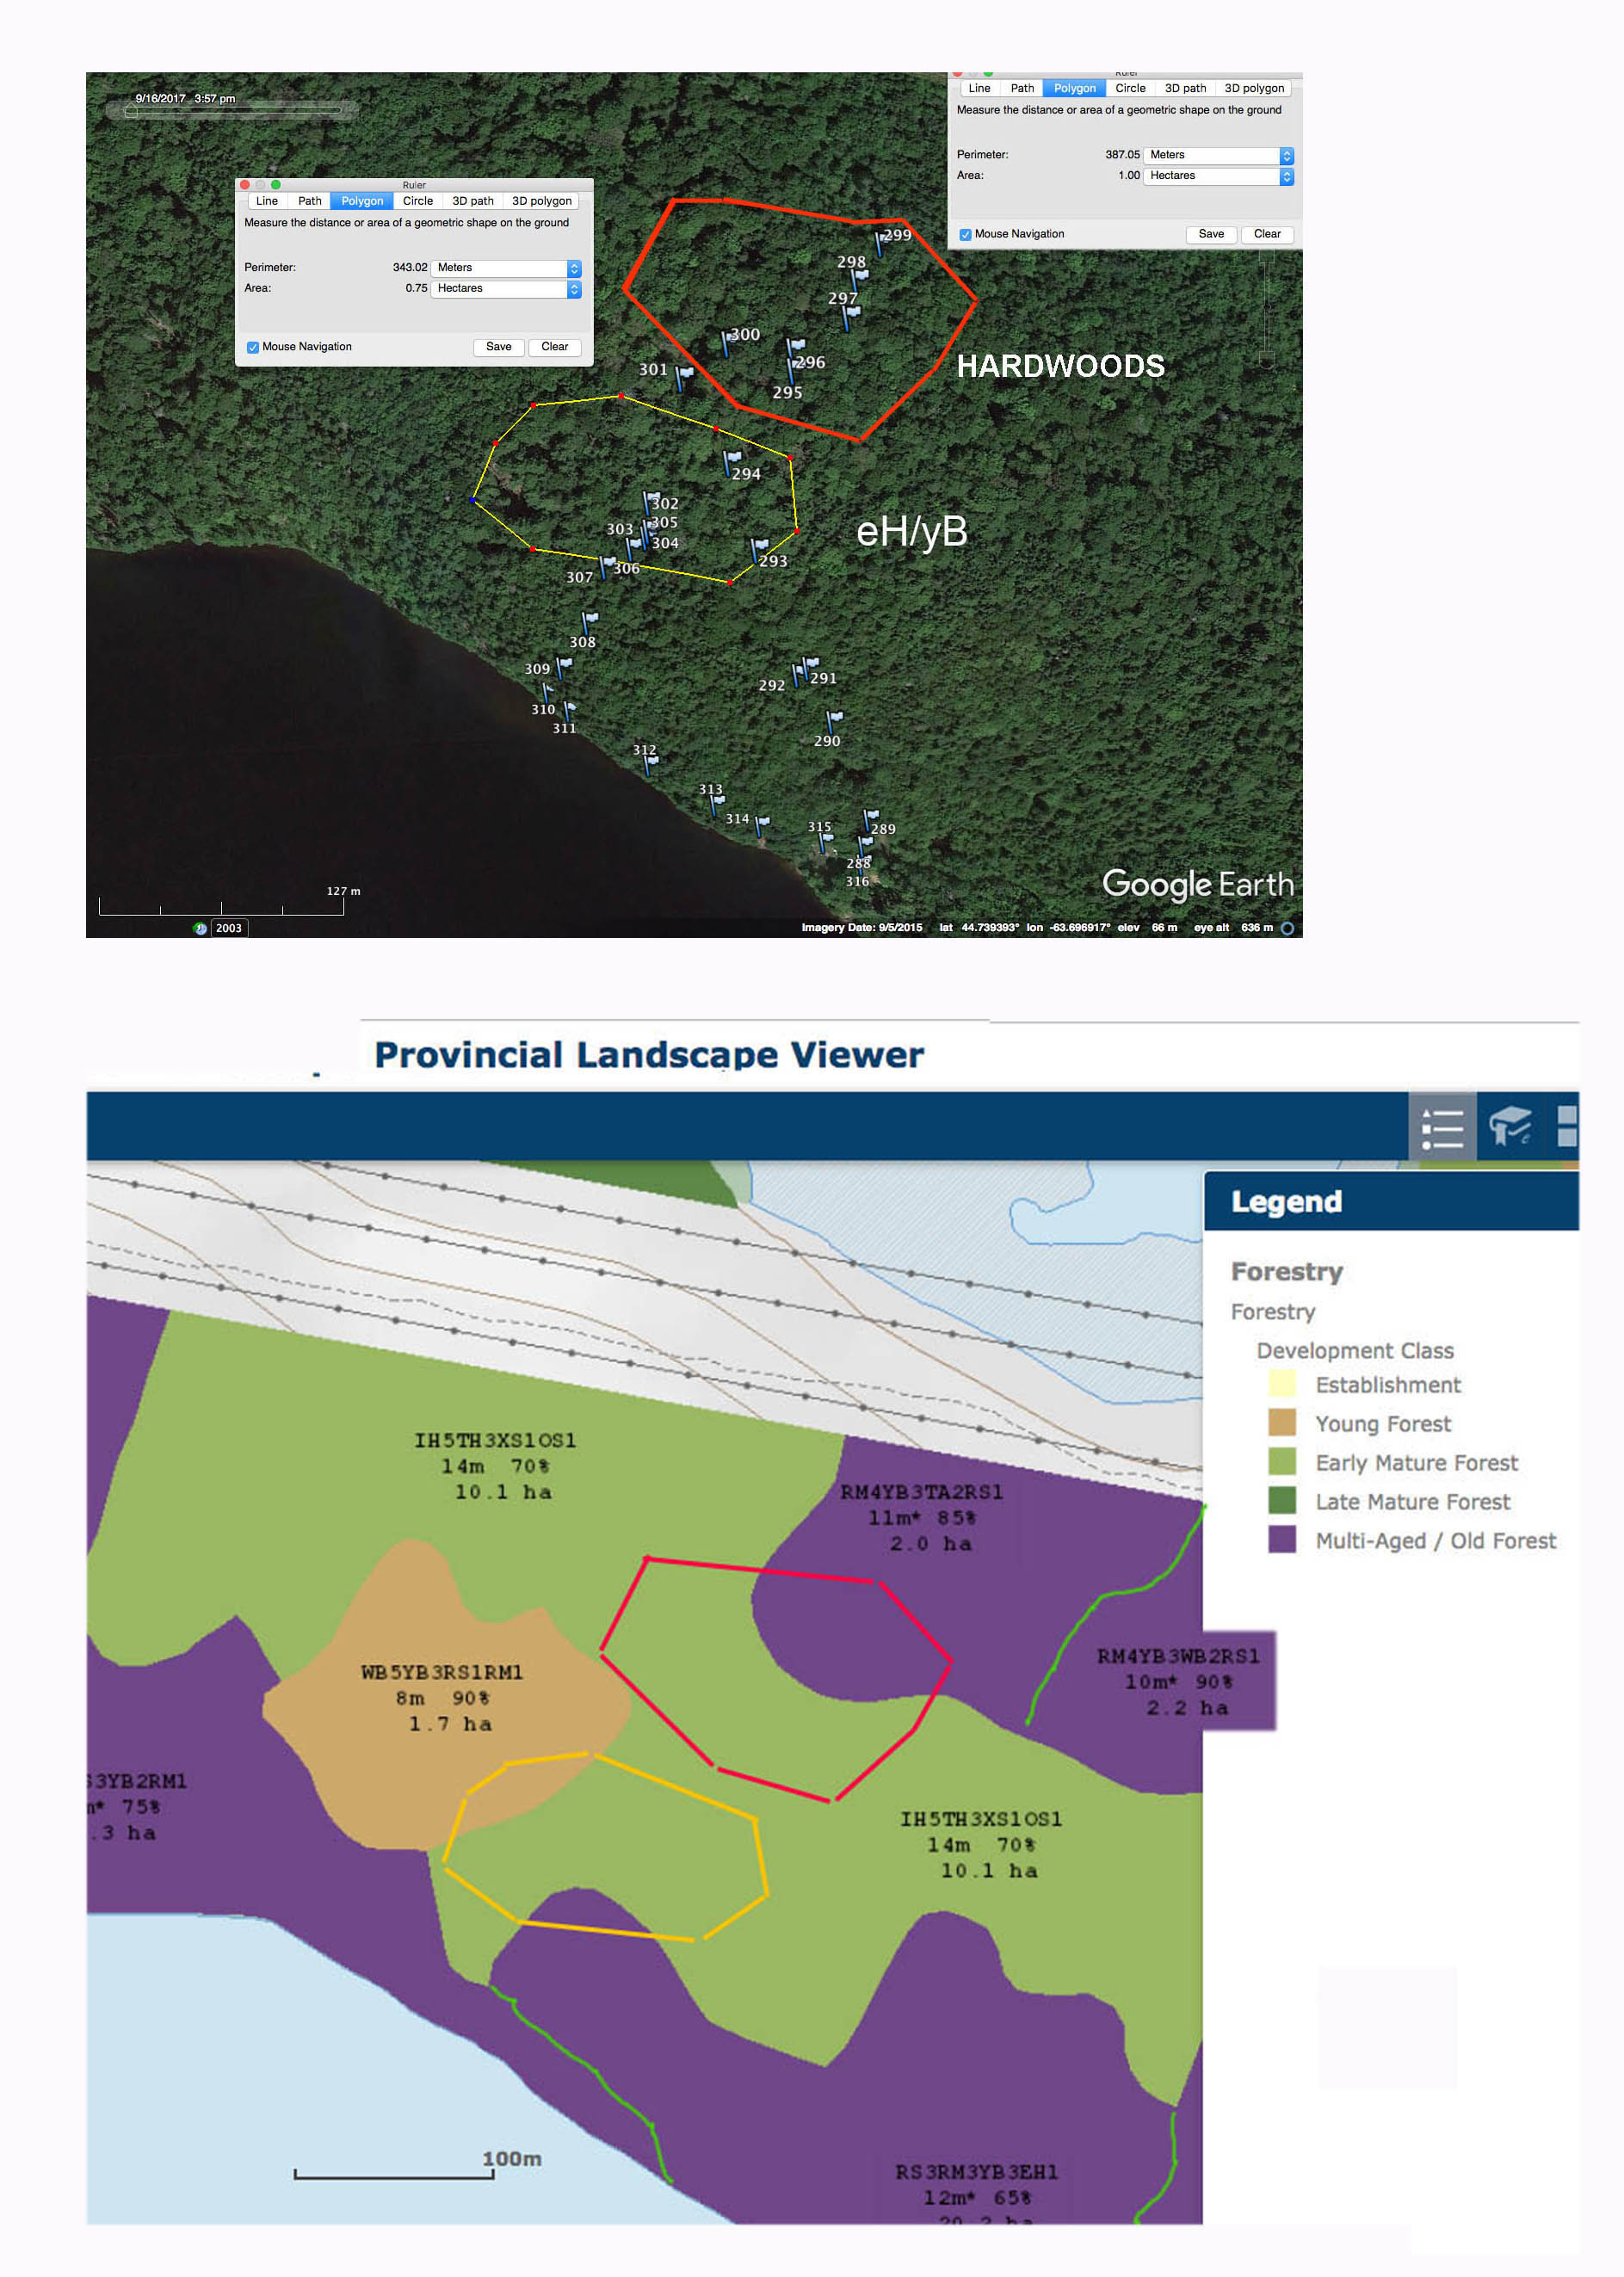
STANDS 2 and 3
Top: My Polygons on Google Earth
Bottom: My Polygons for Stand 2 (eH/yB) and Stand 3 (HARDWOODS) in relation to DNR Polygons revealed in Development Class and Forest Stand Details in the Provincial Landscape Viewer
My Polygon for Stand 2 fell mostly within one of the DNR polygons, but as a small portion of it.
My Polygon for Stand 3 overlapped two DNR Polygons. I am not sure which of those Colin based his initial sampling points on (chosen before he came to the field), but in any case we adjusted on or two of the sampling points so they fell more or less within a visible mixed Hardwood/Softwood stand – that a compromise from my perspective as My Polygon enclosed a Hardwood stand with softwoods a very minor component, mostly in the understory. But to be credible to DNR, we stuck with the protocols, adjusting only as DNR might do where a sampling point clearly does not fall within a “stand”.
Here are the age results by stand:
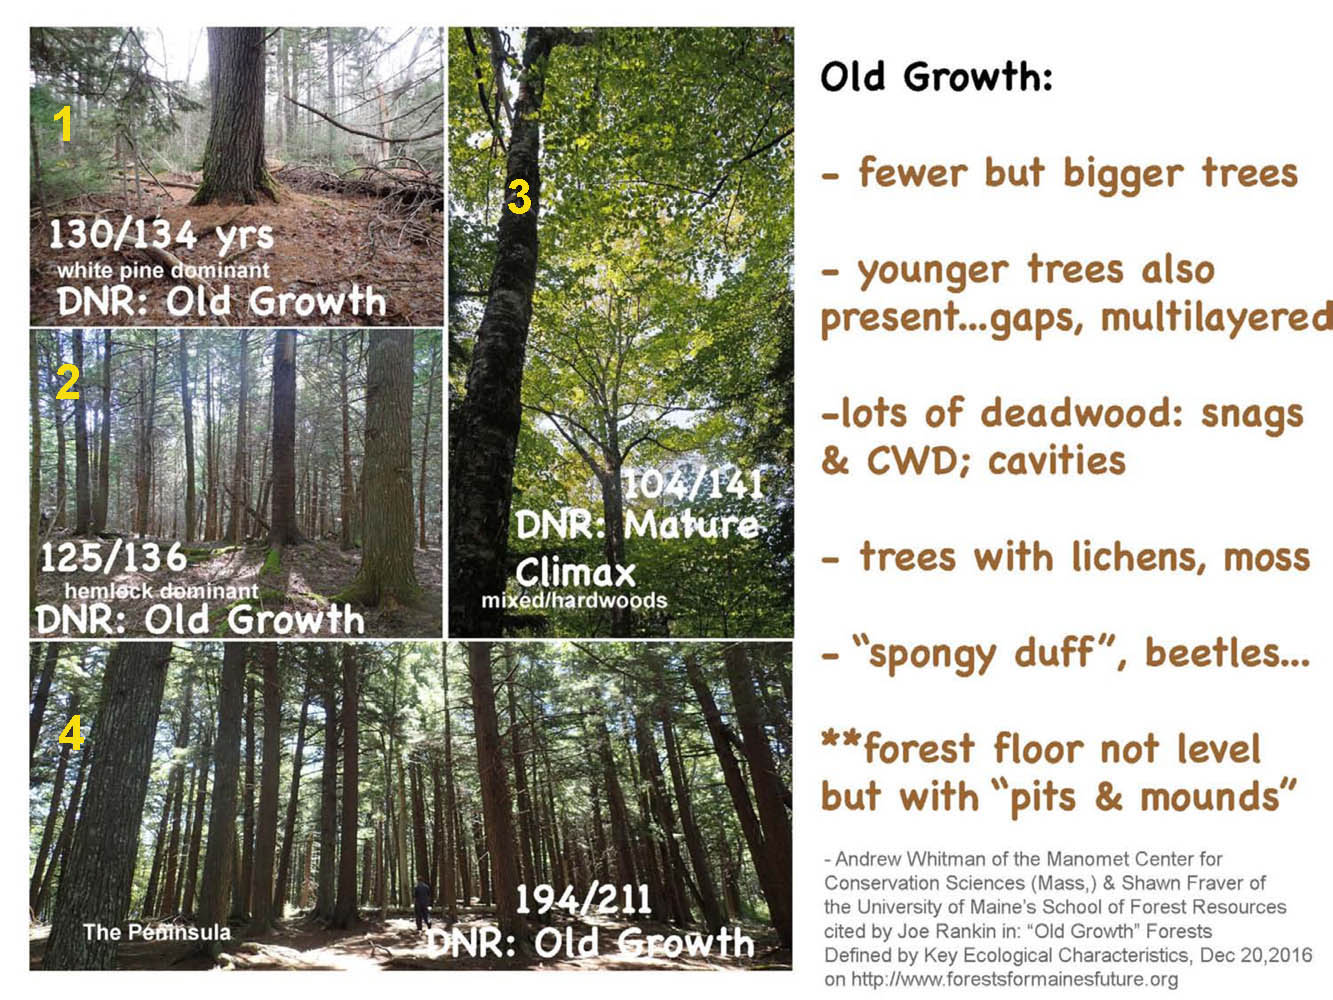
At left, age results for four stands at Sandy Lake (Bedford, NS);
At right features of Old Growth
Stands 1,2 and 3 are those Colin Gray of MTRI and I sampled in Oct of 2017. Stand 4 was sampled by local resident and professional forester Ed Glover/DNR personnel in Oct 2014. The first age (e.g. as in 130/134) is the estimated minimum age for the trees making up the top 30% of the basal area. The second age is the oldest recorded for that stand. Criterion for Old Growth: A forest stand where 30% or more of the basal area is in trees 125 years or older, at least 15 half of the basal area is composed of climax species, and total crown closure is a minimum of 30%. Criterion for Mature Climax: A forest stand where 30% or more of the oldest basal area is in trees 80 – 125 years old, at least half of the basal area is composed of climax species, and total crown closure is a minimum of 30%. (From Old Forest Policy 2012). Old Growth Features are those cited by Andrew Whitman at the Manomet Center for Conservation Sciences and by Shawn Fraver, a professor at the University of Maine’s School of Forest Resources as described by JOE RANKIN in . “Old Growth” Forests Defined by Key Ecological Characteristics in Forests for Maine’s Future, Dec 20, 2016. All except Pits and Mounds are commonly cited features of Old Growth; Whitman and Fraver believe presence of Pits and Mounds should be one of the criteria for designating a forest as Old Growth in forests of northeastern N.A. They were consistent features at Old Growth forest sites at Sandy Lake.
So according to the Old Forest Policy criteria, Stand 1 was clearly Old Growth (avg age of the top 30% of the basal area 130 years; Stand 2 was just on the borderline (125 years) and stand 3 was well below (104 years so was “Mature Climax”)
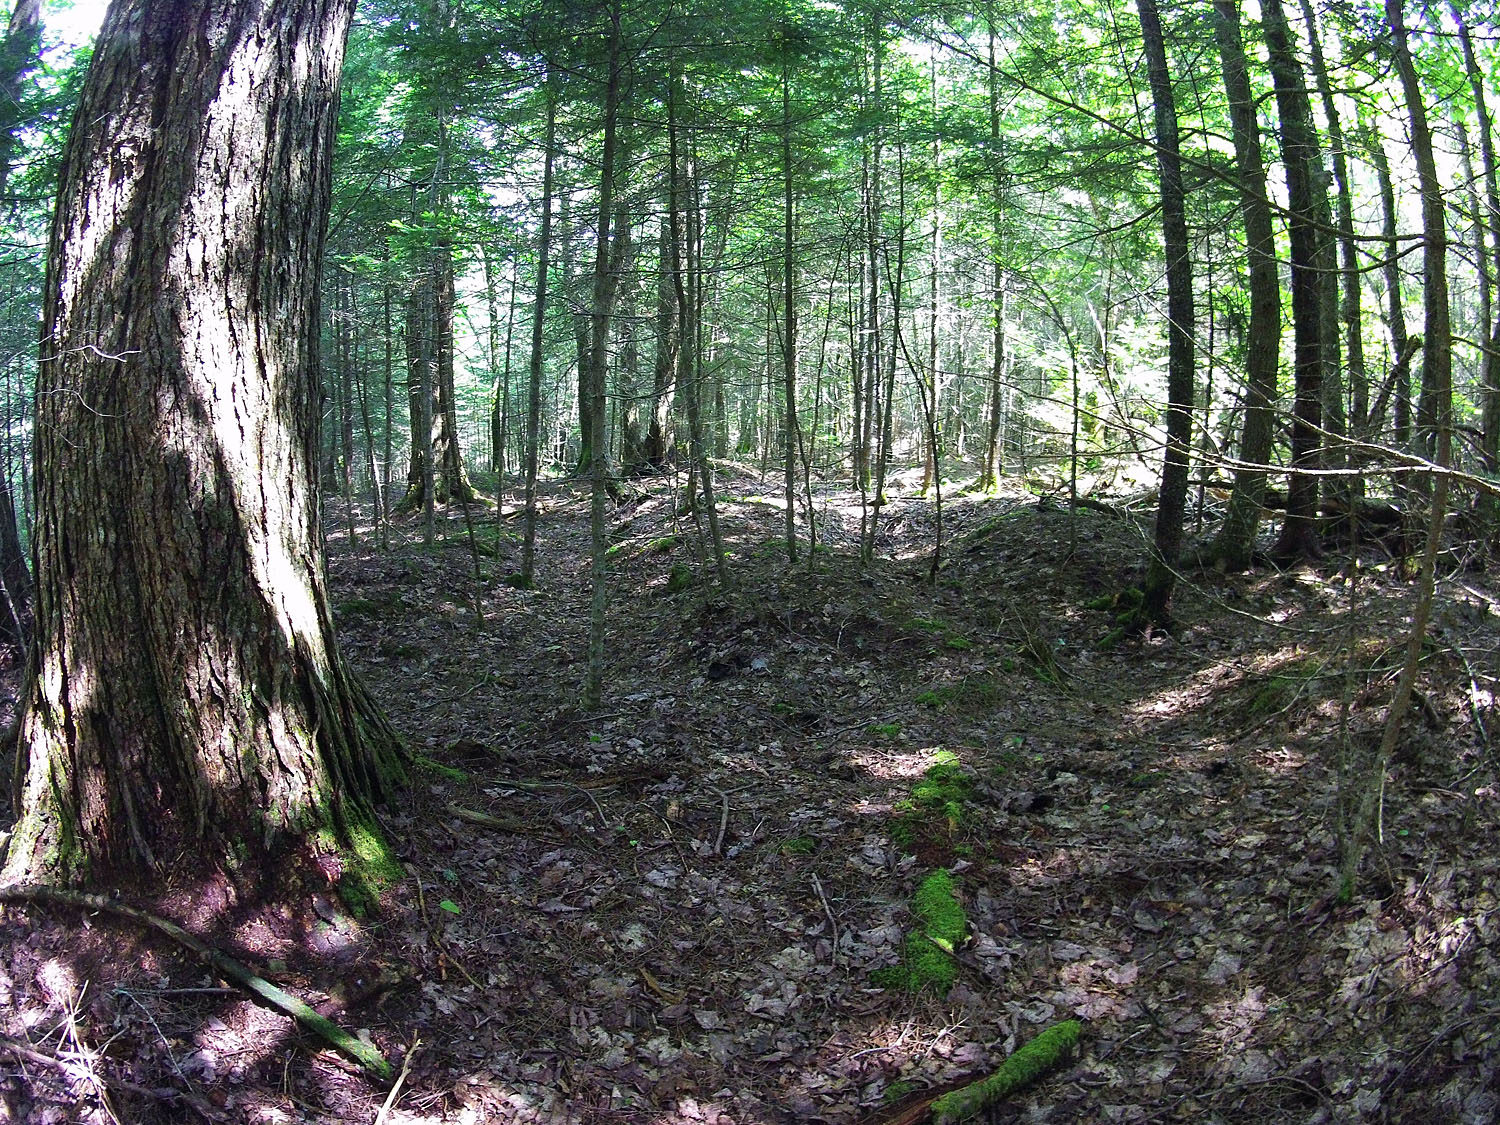
Pit and Mound topography at Sandy Lake
However, Stands 1,2, 3 have similar maximum recorded ages (134 to 141 years), similar overall structural appearance and other observations suggest they all date back to the same disturbance event circa 160 years previously.
So I suspect that the differences in classification, in this case between Old Growth (Stands 1 and 2) and Mature Climax (stand 3) are an artifact produced by the “polygon problem” in one way or another. Of course we could have done more sampling to determine whether that was the case, but did not as that was really beyond the scope of the volunteer study. However, that’s what made me aware of “the polygon problem”.
View more results from the Old Forest assessments at Sandy Lake under
– sandylakebedford.ca>Forests>Mature/OG Forest
– sandylakebedford.ca>Forests>Mature/OG Forest>Old Forest Assessments
Other issues/questions related to the OFP Protocol
- Why should the Old Growth designation under the OFP Protocol be restricted to Old Growth stands that fill or nearly whole DNR polygons?
What should be the size limitation (if any) for a patch/stand to be designated “Old Growth”? - Why is the full range of factors scored not utilized in deciding whether a stand is “Old Growth”?
- There can be considerable discrepancies in the occurrence of stands, what’s in the stands, and their development stage between what we see on the relevant layers in the PLV and what we see on the ground – view maps above as examples. What’s the significance of such discrepancies?
- Why are the PTAs apparently overlooking or missing significant Old Growth? How could that be fixed?
- How might one as a citizen scientist recognize and document patches of Old Growth?
I will discuss these issues in future pages or posts.
– DP Jan 19, 2019
—————————————–
 Thoughts on a day of a solar eclipse
Posted on August 23, 2017. My “discovery” of some Old Growth stands on Aug 21, 2019. “Solar eclipses seem to elicit deep feelings and connections to our larger being, momentarily taking us away from our obsession with the here and now. I had decided to spend the morning of August 21 exploring an area where I thought I might find some old growth forest. In the afternoon, I would paddle down the nearby lake to explore some lakeside wetland under the changing sky of the eclipse. I wasn’t disappointed with the forest…
——————————————
What is a “Forest Polygon”?
My definition (please improve): A polygon in GIS (Geographic Information Systems) is an area delineated on a digital map according to certain features or properties of the area and is used to store and provide access to related information. A “forest polygon” in the Nova Scotia mapping systems corresponds to a distinct forest stand that differs from distinct neighbouring stands, as inferred from “stereoscopic interpretation of true colour aerial photographs”.
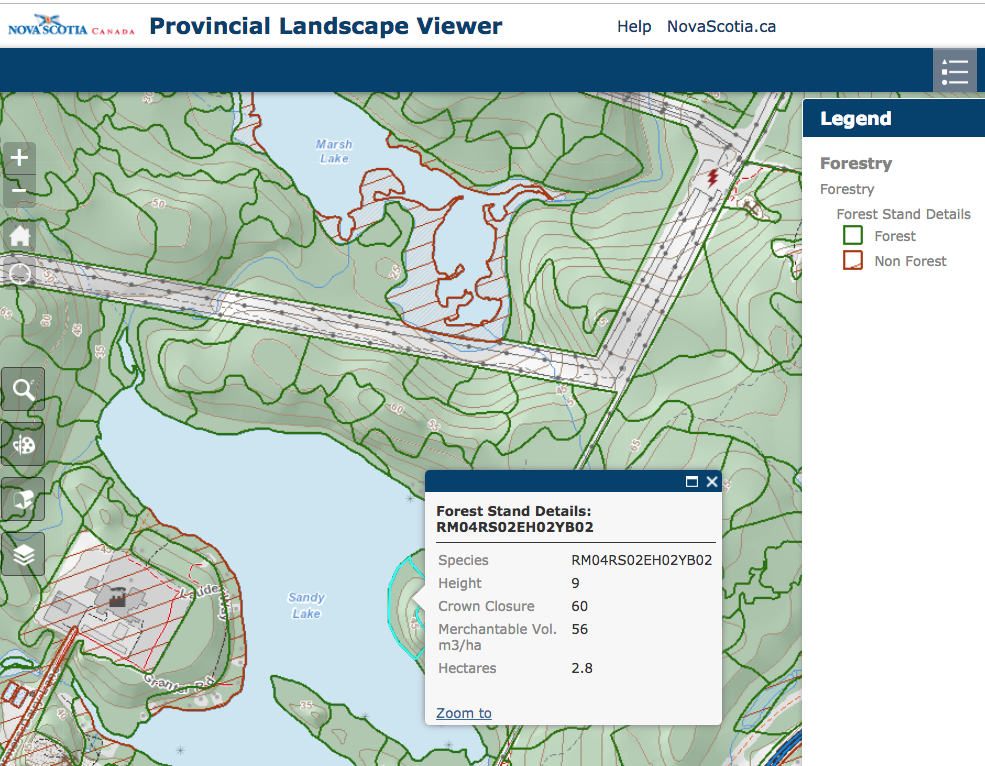
Forest Polygons in the Forest Stand Details layer on the Provincial Landscape Viewer. The box comes up when you click on an individual polygon and gives info stored in that particular layer.
From DNR › Forestry › Forestry Program Areas › Forest Inventory Photo Interpretation:
“The Nova Scotia Department of Natural Resources (NSDNR) obtains aerial photos for 1/10 of the province each year. Using paired photographs, the interpreters can see in three dimensions. The interpreters use this perspective to delineate homogeneous stands of trees [the polygons] and interpret crown closure, stand height, species and land capability (an estimate of productivity). From these interpreted attributes, estimates such as stand basal area and volume are computed and form the basis of the forestry layer stored in NSDNR’s GIS database.
The NSDNR Photo Interpretation Specifications provides more details:
Every hectare of land and water in the province is viewed on aerial photography and classified into one or
more of 21 forest types or 18 non-forest types. For each forest stand or polygon tree species, average codominant tree height of the stand, tree crown closure and site capability to grow forests are recorded. These four attributes are used to derive additional individual stand attributes described in this document. Nonforested areas are also classified into a series of categories described in this document.From 1987 to 1996 the entire province was interpreted and the first version of the digital resources data base was created. The current photo interpretation process is a review and update of the original data base. The update process is designed to cover the province on a continuous repeat cycle of ten years.