‘Workin on it
In a post on Jan 3, 2017, I used the Feds’ Bioenergy GHG Calculator to examine GHG emissions associated with use of clearcut biomass to generate heat and electricity
A Bioenergy GHG (Greenhouse Gas) calculator developed by scientists with Natural Resources Canada allows users to estimate the “time to parity” and net GHG emissions or uptake for forest bioenergy schemes, giving values for Best- and Worst-Case Scenarios.
The “time to parity” is the number of years after initiating a forest bioenergy project that GHG emissions would be higher than if a specified fossil had been used to generate the same amount of heat or electricity.
The GHG emissions are expressed as “CO2 equivalents” and include emissions of GHG gases such as nitrous oxide as well as CO2. ) For forest biomass , most of the emissions are associated with CO2.)
A peer reviewed, open-access scientific paper (2016) provides the rationale and data for the Bioenergy GHG calculator.
However, there is little explanation on the calculator website of how the calculator works, its assumptions or even how to use the calculator. I will attempt to provide some of that info. on this page. (Perhaps that will stimulate the feds to do it.)
As well as being a practical tool I view the calculator as a valuable educational tool.
Scenario Options/Input variables
The calculator allows selection of values for several variables, thereby generating scenarios most relevant to the user.
| VARIABLE | POSSIBLE VALUES |
| Feedstock (required – must be specified) |
– Green Trees – Salvaged Trees – Harvest Residues |
| Growing Speed An option when Green Trees is chosen as the feedstock |
– Fast (45 year) – Medium (75 years) – Slow (120 years) – or by default, “Any” |
| Mean Annual Temperature An option when Salvaged Trees or Harvest Residues is chosen as the feedstock |
-1, 0, 1, 2, 3, 4, 5 or by default, “Any” |
| Transformation | – Chips – Pellets – Renewable Natural Gas – or by default, “Any” |
| Place of use | – Local Market or Export & specify km by Truck &/or Train &/or vessel – or by default, “Any” |
| Energy Conversion (required) |
– Heat – Electricity |
Growing speed refers to the length of time it takes to for new growth to replace the biomass removed.
Mean Annual Temperature goes from coldest (-1) to warmest (5) “The area encompasses five terrestrial ecozones (i.e., Atlantic maritime, Boreal shield, Mixedwood plain, Montane cordillera, and Pacific maritime), where mean annual temperature (MAT) and mean annual precipitation range from −1 to 5 °C” (from the associated scientific paper); I assume “5” for Nova Scotia.
Calculator Output, Example
The calculator generates figures for the cumulative GHG balance, expressed in units of CO2 per unit of energy generated, over time. They are presented in three forms: a graph, a table, and a bar diagram.
Below is an example
Input values for the example
Feedstock: Salvaged Trees
Mean Annual Temperature: 5
Transformation: Chips
Place of Use: local Market Truck: 100 km
Energy Conversion: Heat
Bioenergy system efficiency: 75%
Fossil fuel replaced: Coal
Fossil system efficiency: 80%
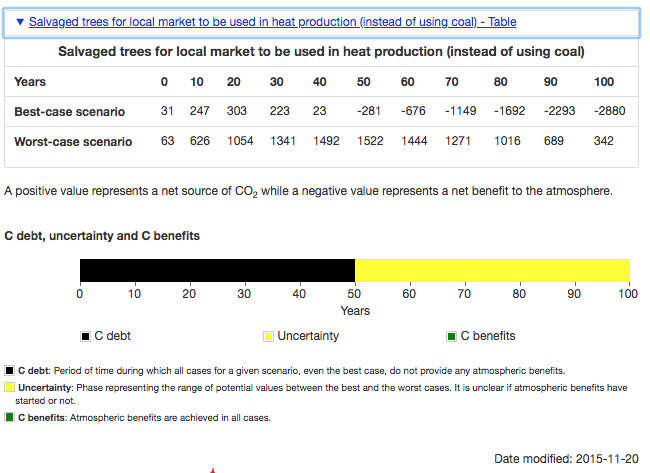
Example Output – :
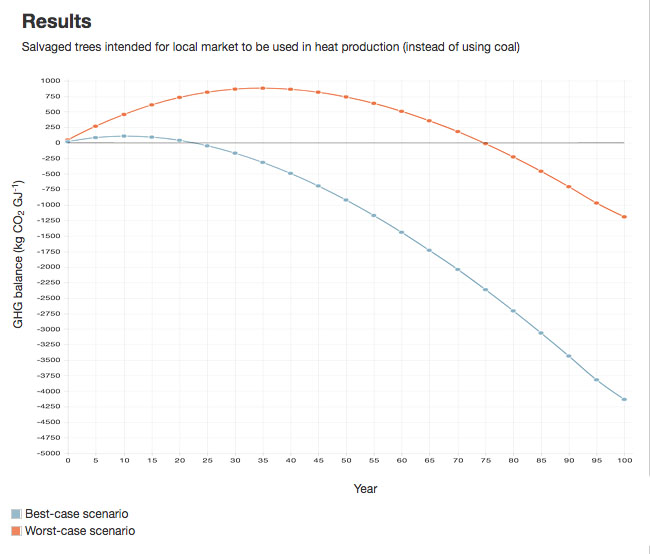
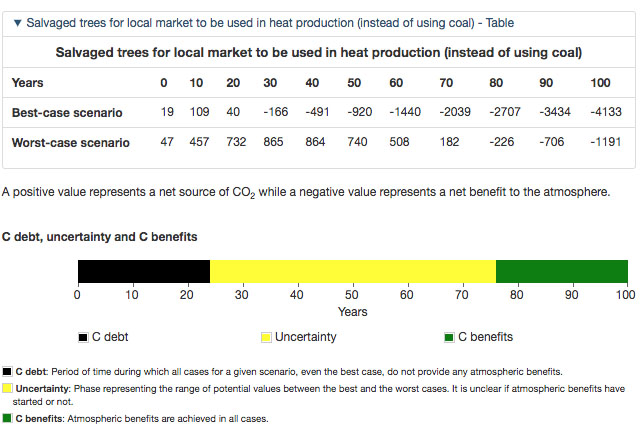
So in this case, the best case scenario emits GHG relative to coal for approx 23 years, and the worst case scenario for approx 77 years.
The period 0-23 years is described as the Carbon Debt phase because in both scenarios, there is net emission of GHG.
The period from 77 years onward is described as the Carbon Benefits phase because in both scenarios there is net uptake of GHG.
The period 23 to 77 years is described as the Uncertainty phase as whether there is carbon debt or carbon benefits depends on the precise configuration of the system.
The Table provides the cumulative (net) GHG emissions at 10-year intervals.
What if?
It is very easy and instructive to change the values for inputs one-at-a-time, which allows a quick evaluation of their quantitative significance.
For instance if we change Transformation from chips to pellets in our example, we get these results (excluding the graph):
The Carbon Debt phase increases to 50 years (from 23), and in the best scenario, no Carbon Benefits are realized in the first 100 years.
Eyeballing the numbers, the output of GHG for pellets is about double that for pellets compared to chips. Evidently, making pellets involves a lot of fuel consumption.
Some further details about the calculator (model)
– “Our forest C analysis assumes constant soil C stocks”
A dubious assumption for Nova Scotia
– Decomposition
Estimating the time course of decomposition of dead wood is a key component of the model. The key factors affecting decomposition can be described broadly as size and temperature and
- the bigger the pieces, the longer it takes to decompose (releasing CO2)
- the higher the temperature, the faster the decomposition
The precise nature of the material being decomposed is also important, e.g., if we were looking at decomposition of beech wood versus poplar wood, the latter would be much faster, however some sort of average composition is assumed as we usually don’t have that level of info about feedstocks in any case.
The various types of dead wood can be lumped into three categories:
– mill wastes
– harvest residues
– salvaged trees
The size of the materials increases in that order (Mill wastes–>harvest residues–>salvaged trees)
Mill wastes are generally small (mm scale) or even dissolved materials, and most or all systems for estimating GHG emissions assume that they decompose fully within one year or less (if not burned). On that basis, the use of genuine mill wastes to generate energy can be regarded as carbon neutral – if the wastes were not burned for energy, they would decompose releasing CO2 in a short period anyway. So the Calculator does not consider Mill Wastes as a possible feedstock just because there are no calculations to be made.
There could be other options for use of mill wastes that would stabilize the carbon for a period, e.g. if they were composted, or made into some type of composite material. If using the wastes for bioenergy diverted materials from such uses, then they may not be carbon neutral, but I am not aware of any research looking at such a scenario.