
Red-Tailed Hawk
Online resources for tracking forest harvests and for viewing related geographically-tagged information for Nova Scotia
Also view the subpages:
– HPMV (some of what you get and do not get on
the harvest Plan Map Viewer)
– Compiled Maps (Whole Province maps of Forest Development Stage, and Old Forest Policy lands)
– iNaturalist
– EAs (Environmental Assessments)
Forest Harvest Allocation Maps
These maps show locations of forest harvests on crown lands planned or conducted since September 30, 2014. When a new allocation is made, an Allocation Map is posted and is open for comment for 20 days. You can subscribe to receive notification of new allocations.* A Map Viewer launched in the spring of 2016 shows allocations for the whole province, and replaces the pdf-based harvest operation maps that the DNR launched in 2014. Unfortunately, there is no equivalent for private lands, which reflects the lack of any significant regulation or monitoring of cutting on private lands in Nova Scotia. *Examples
Once posted, the comment period is open for 40 days.
Note: Existing Parks and Protected Areas can be viewed as a layer on this map but not areas proposed that have not yet been protected. See Interactive map of Parks and Protected Areas (also listed below) to view those areas.
Explainer: Why so many are criticizing Nova Scotia’s forest harvesting map tool (video)
CBC June 2019. For those who’ve raised their voice in concern about clear cutting in Nova Scotia, one of the only methods they have to understand the current state of harvesting is a provincially managed online map. But critics say it’s not giving the public an accurate picture of what forests are coming down and where.
Pre-Treatment Assessment Reference Viewer
Currently (Apr 3, 2018) this provides Wind Exposure 2017; and FEC Soil Type Layers.
To view the Arc GIS version (for which you need user/pwd), go to this link
Nova Scotia Landscape Map Viewer
Convenient for viewing Crown lands, Protected Areas, Ecological land Classification and a lot more. This is a key tool for keeping track of forest management history, extent etc. It takes a while or quite a while to figure it out (at least it did for me; ongoing!). See Codes. Some of the codes I was able to find only in a Photo Interpretation Specifications.
View Help Page for the Provincial Landscape Viewer. Also ELC – Ecological Land Classification for some of the codes; another page with codes including tree species: Forest Inventory – Current Forest Data (Web Version- 2016)
Nova Scotia DataLocator – Elevation Explorer
Topography and Lidar images
Ta’n Weji-sqalia’tiek Mi’kmaw Place Names
“In 2010, Ta’n Weji-sqalia’tiek Mi’kmaw Place Names Digital Atlas and Website Project (formerly Pjila’si Mi’kma’ki: Mi’kmaw Place Names Digital Atlas and Website Project) was launched to document approximately 13,000 years of Mi’kmaw presence within Mi’kma’ki, the place of the Mi’kmaq, and to raise public awareness of this ancient history…To date, the research team has recorded approximately 1,500 place names collected through interviews with Mi’kmaw Elders and other knowledge holders…”
Nova Scotia Parks and Protected Areas Interactive Map
You can view:
-secondary water sheds
-sites in the proposed parks and protected areas plan (Feb 2013)
-sites in the final parks and protected areas plan (Aug 2013)
-sites in the final parks and protected areas plan still to be designated or subject to considerations
-areas considered protected
-provincial crown land
NS is well lit up
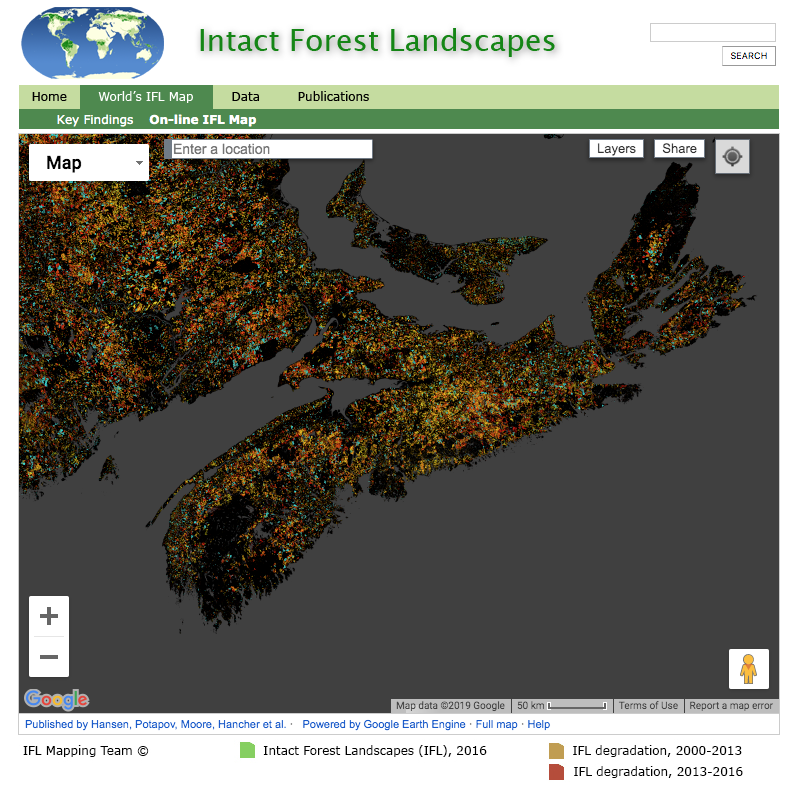
Intact Forest Landscapes
Interactive Map, shows IFL in 2016; IFL degradation 2000-2016 and 2013-2016
Nova Scotia Forest Maps
Interactive site. No help Info. From Bev Wigney:
A couple of times recently, I’ve been asked how you can find the Crown land forests in an area. Here are instructions which should work:
– Go to this URL where you should find a map of Nova Scotia with the entire province divided into a grid. Each box in the grid represents ONE forest map. https://fernow.novascotia.ca/forestpdf/
Zoom in your view of the map to locate the map that you wish to view. Each map has a name – usually the name of the largest town on that particular map.
– To download the map that you want — go to the top right of the page. There is a box that says “ONE MAP”. Click on that box. Now, go to the map square that you wish to download. Click on that map. You should see a little pop-up on the screen now — it will say “Map Name”, and “Sheet No” and a button saying DOWNLOAD. Click on that button. The map should now be downloaded to your computer — and will be wherever your downloads go.
– To view your download, you go to the download file and you’ll see that there a .zip file of the map. The file will have a name something like “DNRZO8QzVhNpdf.zip. You should be able to click on that file and it will expand and reveal another file inside which is a .pdf file of the map.
– Once you have the file up on your computer, look for areas surrounded by a GREEN border. Areas surrounded by GREEN over top of a dot-and-dash black line are Crown lands. Those surrounded by GREEN over a solid black line are Provincial Parks and Wilderness Areas. There are other designations as well (National Parks, etc). Look at the KEY at the bottom of the map to help understand the designation of various tracts.
– One further thing that you can do with these maps is to find out the general make-up of the trees — at least based on data collected in the past. I’m not going to get into this part of the map too much beyond mentioning that there are lists of CODES down at the bottom of the map. They can be used to see what kind of land designation a tract has been given — for example OF is “Old Field” – retired farmland. – There are CODES for Tree species – Softwoods and Hardwoods are listed separately. At the bottom right of the map is a diagram explaining how to use the CODES to read the description of the forest on the tract of land you are viewing.
– I hope all of that will be of help to those who wish to see what Crown land forests may be in your area.
I think these are older maps, not updated. I believe the same info can be found on the Nova Scotia Landscape Viewer, however the PDF maps be more convenient for some purposes.
Nova Scotia Crown Lands Viewer
A spatial dataset of all Crown lands in Nova Scotia.
Crown land index maps (historical land grants) are also available online (separate site)
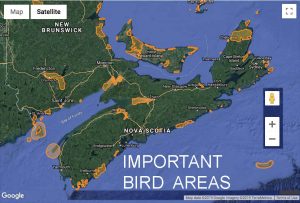 Important Bird Areas (IBAs)
Interactive Map on IBA Canada
>DNR>Geoscience & Mines Branch: Interactive Maps
Geoscience map has surficial geology, bedrock layers etc; groundwater atlas map, acid rock drainage map; others
1:10,000 Nova Scotia Watersheds
Online map, outlines and ID info given. “1:10,000 watersheds for Nova Scotia. Contains primary, secondary, tertiary and sub-tertiary watersheds”
NS Lake Survey program Interactive Map
Gives secondary watersheds, limnological data for lakes.
Nova Scotia Watershed Assessment Atlas 2014
PDF, Dalhousie University
Water Resource Reports and Maps
NSE Maps
1:10,000 Secondary and Shore Direct Watersheds of Nova Scotia
Nova Scotia Environment Water Strategy More maps available on that page.

Clearcut on Crown Land in 2014
National Forestry Database: 88% of NS forest cuts in 2014 were clearcuts
“The National Forestry Database is Canada’s Compendium of Forestry Statistics, serving as our national source of credible, accurate, and reliable forestry statistics.” Data are given for both Crown and Private lands. Read more // view Silviculture – Jurisdictional Tables
UPDATE July 8, 2018: They have recently changed the format to interactive tables: See Canada’s National Forestry Database
For harvests in NS, see http://nfdp.ccfm.org/en/data/harvest.php
(I find it much more difficult to find the stats I am looking for under the new system.)
The Canadian Forest Service/UBC/Canadian Space Agency Satellite Forest Monitoring Map
Interactive; map shows changes in forest cover associated with fire, infrastructure, harvest and in an “Untyped” category for all of Canada over the interval 1985 to 2011. See example on this website.
Global Forest Watch Interactive Map
Select the interactive map to view “tree cover loss” and/or “tree cover gain” over selected intervals from 2001 to 2014. You can select any area in the world and zoom in. A lot of the tree cover gain seen, likely most, in Nova Scotia is in recovering clearcuts; it is not due to afforestation. View examples:
Clearcutting near Halifax revealed by Global Forest Watch Images.
HFC Blog: TIME LAPSE OF NS FOREST LOSS 2001-14 (3 sites)
Google Timelapse
“Timelapse is a global, zoomable video that lets you see how the Earth has changed over the past 32 years. It is made from 33 cloud-free annual mosaics, one for each year from 1984 to 2016, which are made interactively explorable by Carnegie Mellon University CREATE Lab’s Time Machine library, a technology for creating and viewing zoomable and pannable timelapses over space and time. Thx to NW for pointing this one out. Not as sharp (not as high res) as what you get from the Global Forest Watch Interactive Map, but this one covers more years. Very easy to use.
Planet Explorer
Powerful interactive map tool showing satellite images over short intervals; useful for tracking road-building, harvests etc.
Nova Scotia Government’s Open Data Portal
“Making government data easier to access for individuals, businesses, and researchers”. Unfortunately, it “doesn’t work” for most people without some specialized training and access to GIS software. See Linda Pannozzo on The case of the disappearing forest age class datain relation to the Forest Inventory file. The Photo Interpretation Specifications document provides some important info./definitions.
NFIS Nova Scotia Map Data
NFIS is “Canada’s National Forest Information System“, set up to “answer questions on matters relating to sustainable forest management in Canada.” This interactive mapcshows Forest Cover (Mixed, Coniferous, Hardwood), with options for other layers (parks,roads, rivers etc). Easy to use. Also shows the Ecological land Classification regions/Districts/Sections.
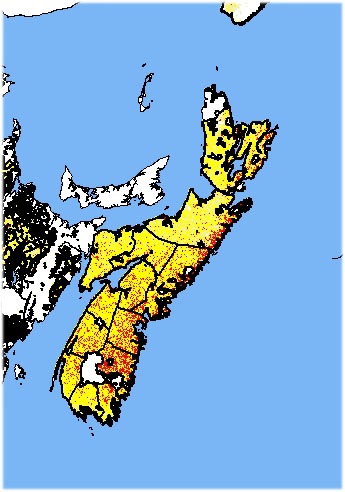
From “Map of the merchantable volume of the “mature forest” in Canada”
Map of the merchantable volume of the “mature forest” in Canada
“This publication contains a raster maps at 250 m resolution of the merchantable volume (m3/ha) of the mature Canadian forest available for harvesting in the next 20 years (2011 to 2031).” I can’t figure out how to see a map with that resolution.. there are few details about how to use he online map. Anyway, it should provide predictions of precisely where harvesting could occur over the next 20 years. NS shown at crude level at right. (Accessed Nov 22, 2018)
FOIPOP: Tools for the Public
FOIPOP is the acronym for Freedom of Information and Protection of Privacy. It is now relatively easy to “do a FOIPOP”, as outlined on this Tools for the Public page. There is even a Government Online Access Request Form although I have not yet been able to see it, getting a “System Unavailable” message. (May 11 & 12, 2018). Cost: “There is no fee for requesting your own personal information. All other requests are subject to a flat fee of $5.00. Processing and copying costs may also be charged at the discretion of the public body. The public body must provide you with a fee estimate. Fee waivers may be available upon request. View FOIPOP Requests
Uncertainty in photo-interpreted forest inventory variables and effects on estimates of error in canada’s National Forest Inventory
Steen Magnussen and Glenda Russo 2012, The Forestry Chronicle 88: 439-447. “Canada’s National Forest Inventory (NFI) relies on photo-interpreted forest resource data provided by provincial and territorial agencies. NFI data are collected at regular intervals in time from a nominal 20 × 20 km network of 2 × 2 km photoplots. Attribute-specific NFI estimates of precision include contributions from sampling errors and uncertainty in the source data. We assessed this uncertainty in NFI photo-interpreted forest attribute data from New Brunswick and Nova Scotia…estimates of precision were inflated by an average of 7% (range 0%–36%) due to the uncertainty in the source data. Species misclassification and age determination were the largest sources of uncertainty.
Some Interactive Maps on data.novascotia.ca: nature and Environment
– 1:10,000 Nova Scotia Watersheds (Environment and Energy) Interactive Map
– Crown Land (Lands, Forests and Wildlife)
– Crown Land Harvest Plans (Lands, Forests and Wildlife) Interactive Map but without some of the features on the HPMV
– Deer Management Zones (Lands, Forests and Wildlife)
– Ecological Land Classification (ELC) – 2007 (Lands, Forests and Wildlife)
– Ecological Land Classification (ELC) – 2015 Lands, Forests and Wildlife)
– Lands Contributing to the NS Protected Areas System (Environment and Energy)
– Nova Scotia Topographic Database – Land Cover (Lands, Forests and Wildlife)
– Nova Scotia Topographic Database – Designated Areas (Lands, Forests and Wildlife)
– Nova Scotia Topographic Database – Digital Terrain Model (DTM) (Lands, Forests and Wildlife)
– Nova Scotia Topographic Database – Landforms (Lands, Forests and Wildlife)
– Nova Scotia Topographic Database – Water Features (Lands, Forests and Wildlife)
– Old Forest – 2006 (Lands, Forests and Wildlife) Interactive Map
Pulse: Interactive Map showing Global and Local Methane levels
On the free version of the map, the data is refreshed weekly to indicate average methane emissions for the previous month.
View Montreal-based GHGSat unveils global map of methane concentrations By Jean−Benoit Legault in the National Observer oct 21, 2020. “A Montreal company has unveiled what it boasts is the most accurate map of global methane concentrations ever made. On Wednesday, GHGSat unveiled Pulse, an interactive map available for free online that has a resolution of approximately two kilometres by two kilometres. GHGSat produced the map from data generated by the company’s satellites along with information from partners such as the European Space Agency. A paid version of the map with a resolution of 25 metres by 25 metres is also available.Methane accounts for a quarter of all man-made greenhouse gas emissions. According to the science journal Nature, methane emissions have risen by nearly 10 per cent over the past two decades — mainly from agriculture and the natural gas industry.
And for a really long term perspective
– Interactive map of Earth shows where your home was 500 million years ago
Rob Waugh, Yahoo News Sep 7, 2020 View Map o, 20, 35, 50…to 750 million years ago.
———–
May 8, 2019
To Forestry Maps,
Members of our forest ecology group here in Annapolis county, would like to see a map (or maps) of previously harvested parcels. Does a map layer exist that shows all of the previous harvests with interactive pop-up windows showing what year they were harvested, along with the harvest prescription, and subsequent silviculture activities? Surely such a map exists.
regards,
Bev Wigney
Reply (May 8, 2019):
Ms. Bev Wigney,
We are actively working to sharing the proposed harvest plan data previous available on the Crown Land Fibre Allocation pdf maps that pre date the Harvest Plans Map Viewer. We will notify you when this information is available.
Thank you for your comment.
Forestry Maps