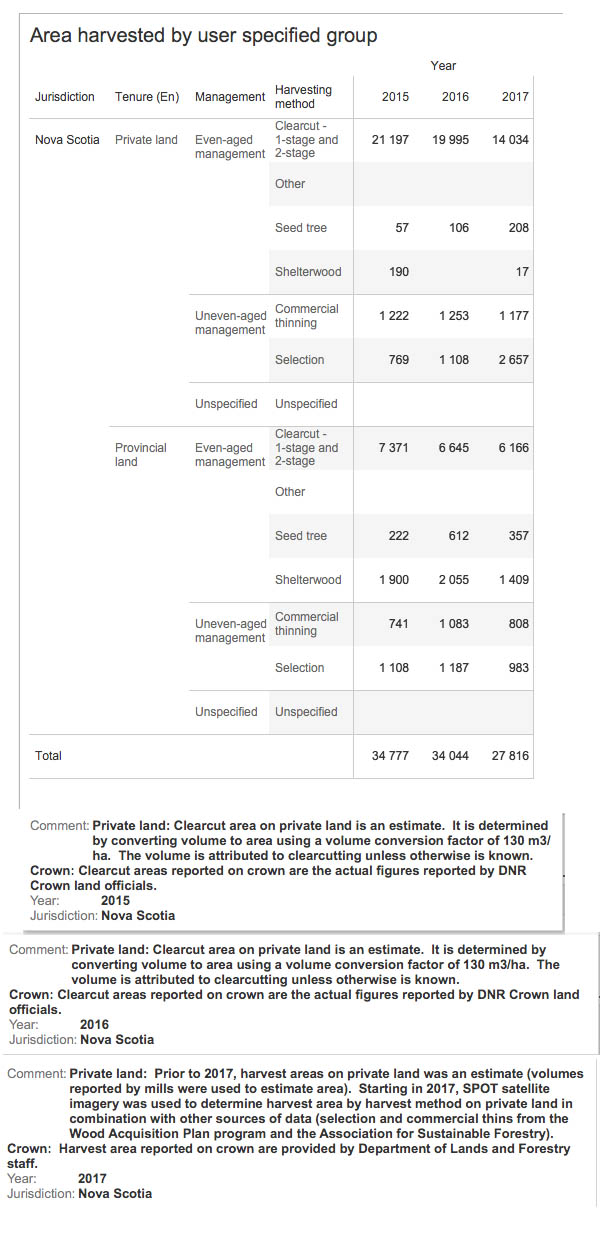
It seems that the change in the way the area clearcut, in particular, was estimated in 2017 compared to earlier years indicates that the area of land clearcut on private land had been over-estimated in earlier years.
I have not accessed the National Forestry Database for some time and the format has changed from the readily available and copyable compilations to an interactive format that, well, involves some frustration in learning how to use it.
I had to install “Tableau” to view the stats in a form that is easy to copy by screen capture.(Printing out stats from the NFD webpages just doesn’t work properly, you get only parts of the tables; I haven’t figured out yet how/if you can print it out from Tableau.) Also, I had lots of difficulties getting the desired language in all places etc., and units are not given in the headings. The Tableau program will prove clunky on slower computers.
Anyway, leaving those difficulties aside, there was an interesting change in the way the area harvested on private lands in NS was calculated in 2017, the latest year for which the stats are available:
Below are data for area harvested in 2015, 2016 and 2017 for NS, as compiled in Tableau
It seems that the change in the way the area clearcut, in particular, was estimated in 2017 compared to earlier years indicates that the area of land clearcut on private land had been over-estimated in earlier years:
NOTE Sep 16, 2019 4 pm. Apologies, I had made a mistake in these numbers as posted this a.m. and have corrected the table above. With the new method of estimating clearcuts on private land, the % clearcut on private land is reduced substantially from earlier estimates (77% in 2017, versus 89-90.5% in 2015 & 2016) but is still higher than the percentage for Crown lands (63% in 2017).
‘Hard for me, at least, to interpret the drop in total harvest 2016 to 2017, without more info about wood supply agreements, results from NS forest timber supply models etc. Harvests on Crown lands were reduced in SW Nova Scotia in the latter half of 2017 with the initiation of the Independent Review so the drop total harvests on Crown lands is not surprising; however private land harvests dropped as well.
It will be interesting to see what the stats for 2018 will look like – harvesting on Crown lands in SW Nova Scotia was reduced over the first 8 months but took off in the fall; and for 2019, after L&F eliminated the use of the word ‘clearcut’.
————————–
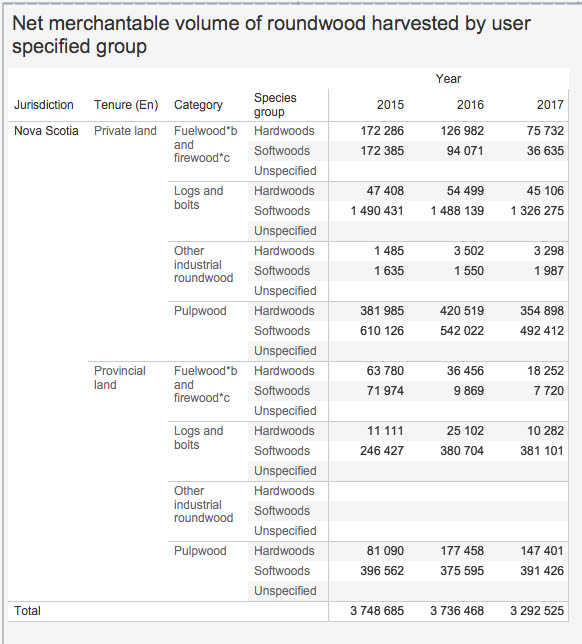
Below are the stats from the NFD for volumes:
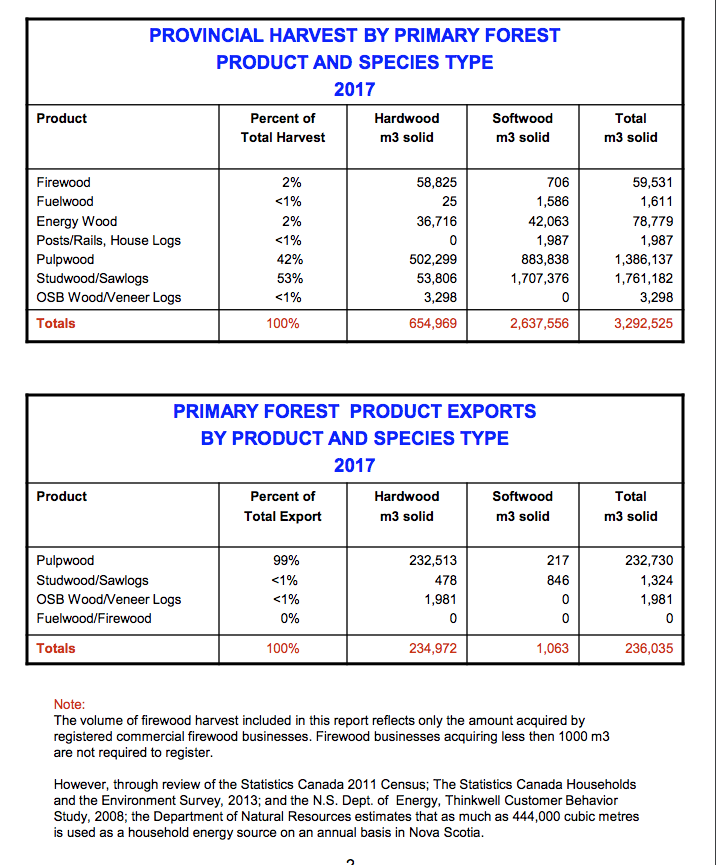
The volume data are apparently drawn from the same dataset summarized in the Registry of Buyers Annual Report for 2017 published by L&F, which continues to note that
The volume of firewood harvest included in this report reflects only the amount acquired by registered commercial firewood businesses. Firewood businesses acquiring less then 1000 m3 are not required to register. However, through review of the Statistics Canada 2011 Census; The Statistics Canada Households and the Environment Survey, 2013; and the N.S. Dept. of Energy, Thinkwell Customer Behavior Study, 2008; the Department of Natural Resources estimates that as much as 444,000 cubic metres is used as a household energy source on an annual basis in Nova Scotia.
That statement has been appearing for years without any further clarification. It seems to suggest there is significant under-reporting of harvesting, based on the related stats in the Registry of Buyers Annual Report for 2017:
I suppose much of the concern about area harvested, clearcutting etc. will be considered, by some anyway, to be mute if The Mill closes and the Forest Industry as we currently know it collapses.
Regardless we will still need reliable stats on forestry in NS to move ahead. It’s encouraging that we can still get some of them from the National Forestry Database even if it’s a bit more complicated to do so.
